How to Use This Site - PhilaDAO Data Dashboard
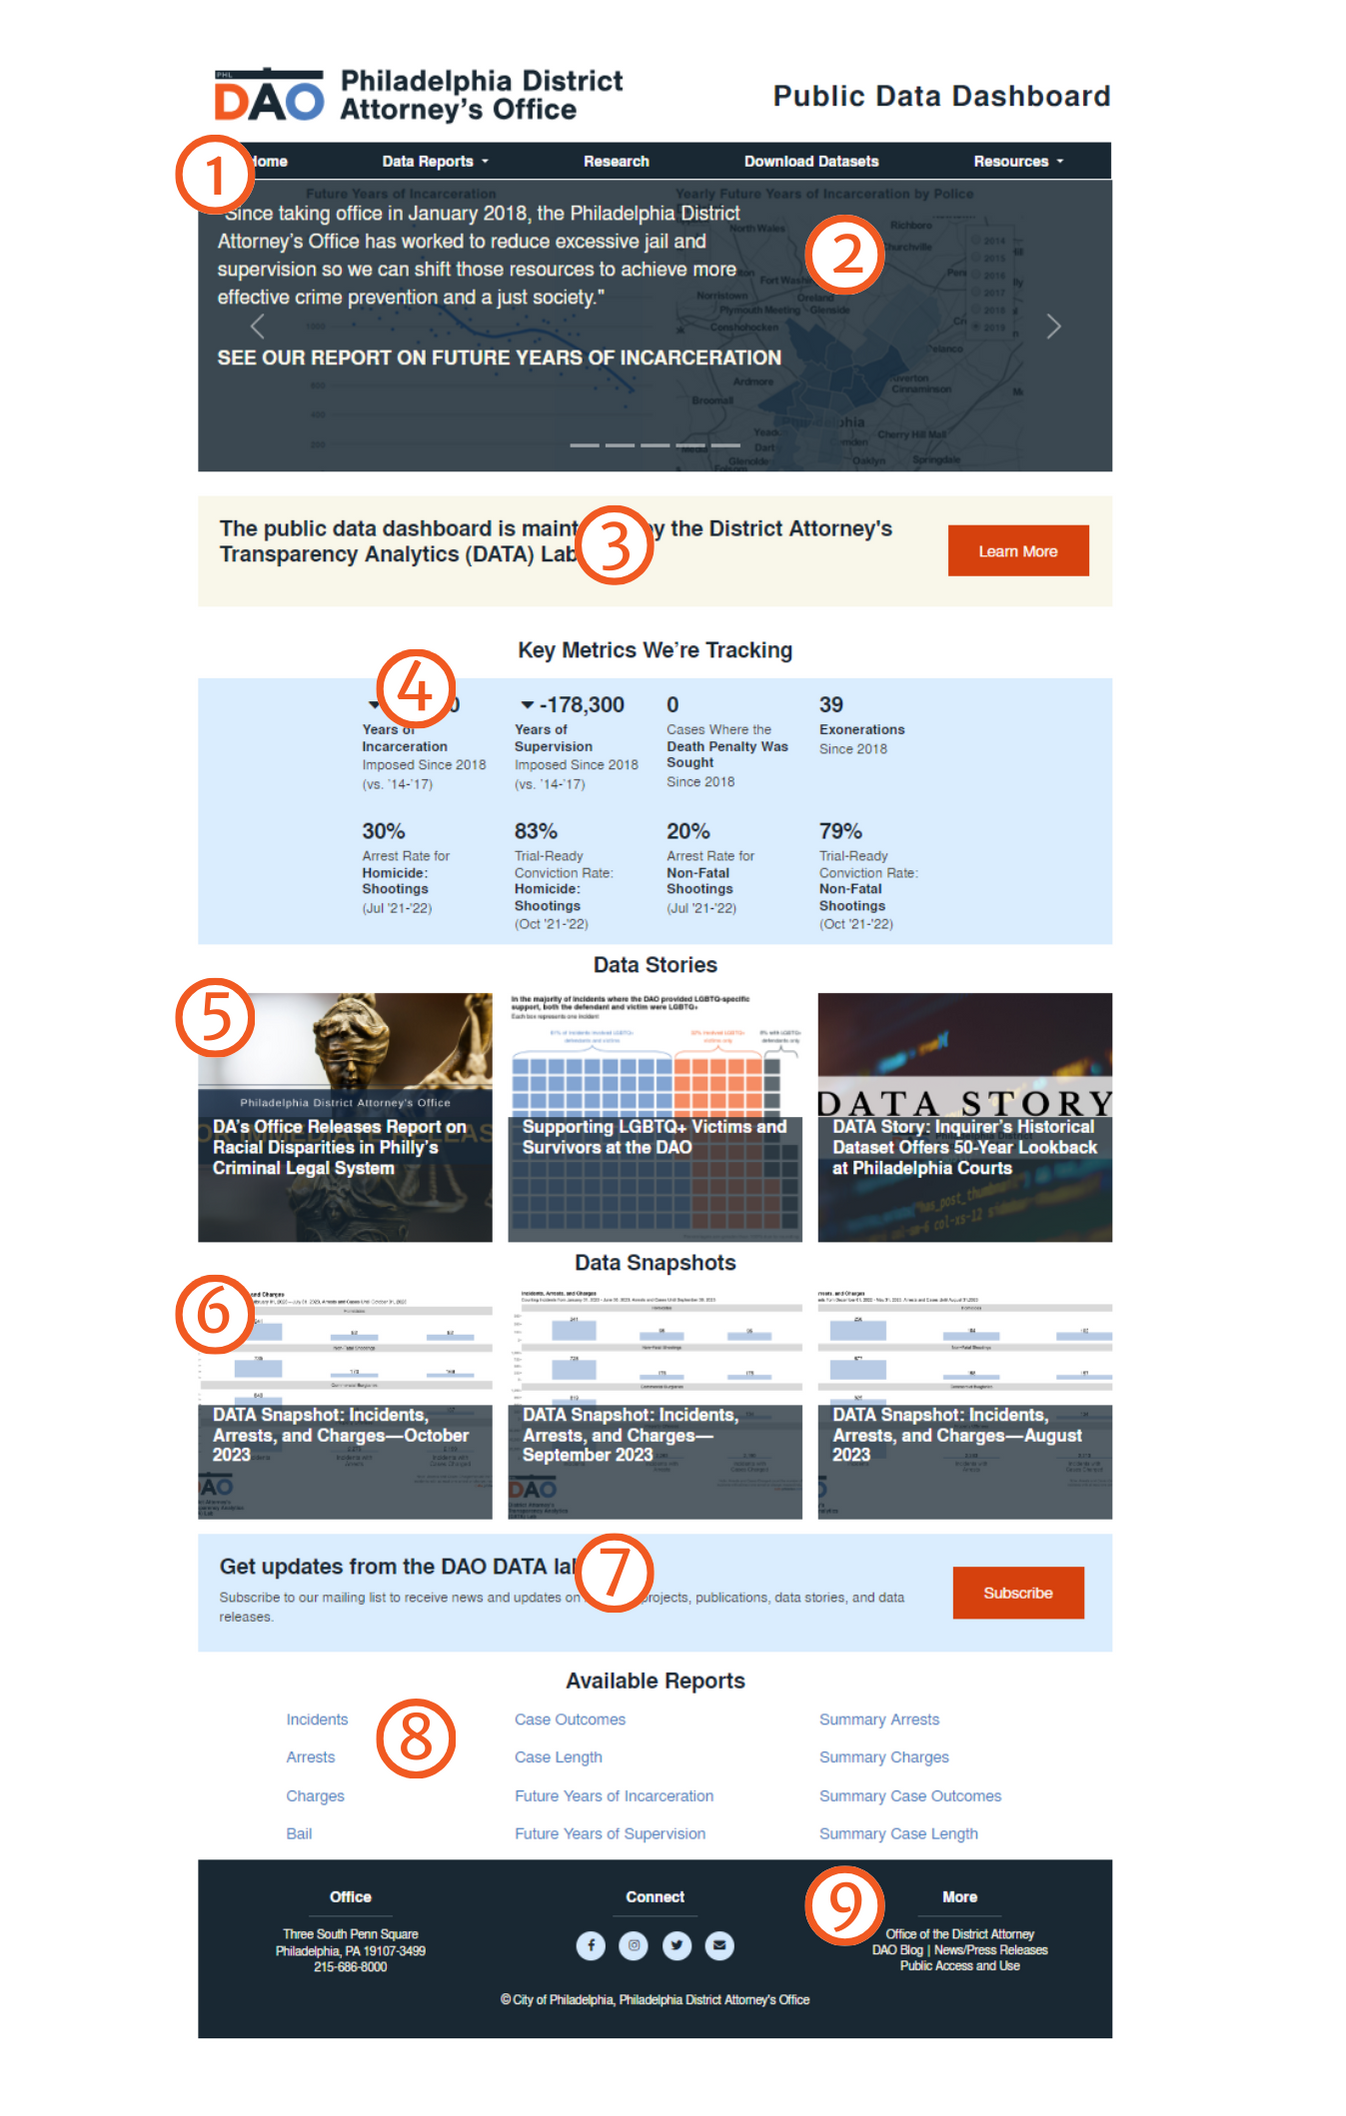
The Home Page of the Philadelphia DAO Public Transparency Dashboard helps you to navigate to the various data reports as well as see key information and data stories that the DAO wants to highlight.
Components
-
Menu Bar
Allows for navigation between individual reports and pages of the dashboard. -
Major Stories
This area has links to important notices and stories about the dashboard and the data within. -
About the DATA Lab
This section notes that the Public Data Dashboard is maintained by the District Attorney’s Transparency Analytics (DATA) Lab and links to the About the DATA Lab page on the DAO website. -
Key Metrics
The home page has its own key metrics that the DAO feels most strongly reflects the goals of the office. These metrics do not always come directly from data found in the dashboard and are intended to compliment the key metrics found in each report. These metrics are updated daily, just like the reports. -
Data Stories
Although raw numbers are important, it is critical to understand the context surrounding criminal justice data to fully understand the raw numbers. This area shows the most recent Data Stories where we consider data and criminal justice issues. -
Data Snapshots
This section links to monthly summaries of incidents, arrests, and charges filed. -
Subscribe to Newsletter
This area contains a button that links to the DATA Lab’s newsletter subscription form. The newsletter is a low-volume, quarterly update on new reports, research, and data resources from the DATA Lab. -
Available Reports
A set of links to the data reports available on the Dashboard. -
Connect and Contact
Look here to learn more about the Philadelphia District Attorney’s Office or connect with us on social media.
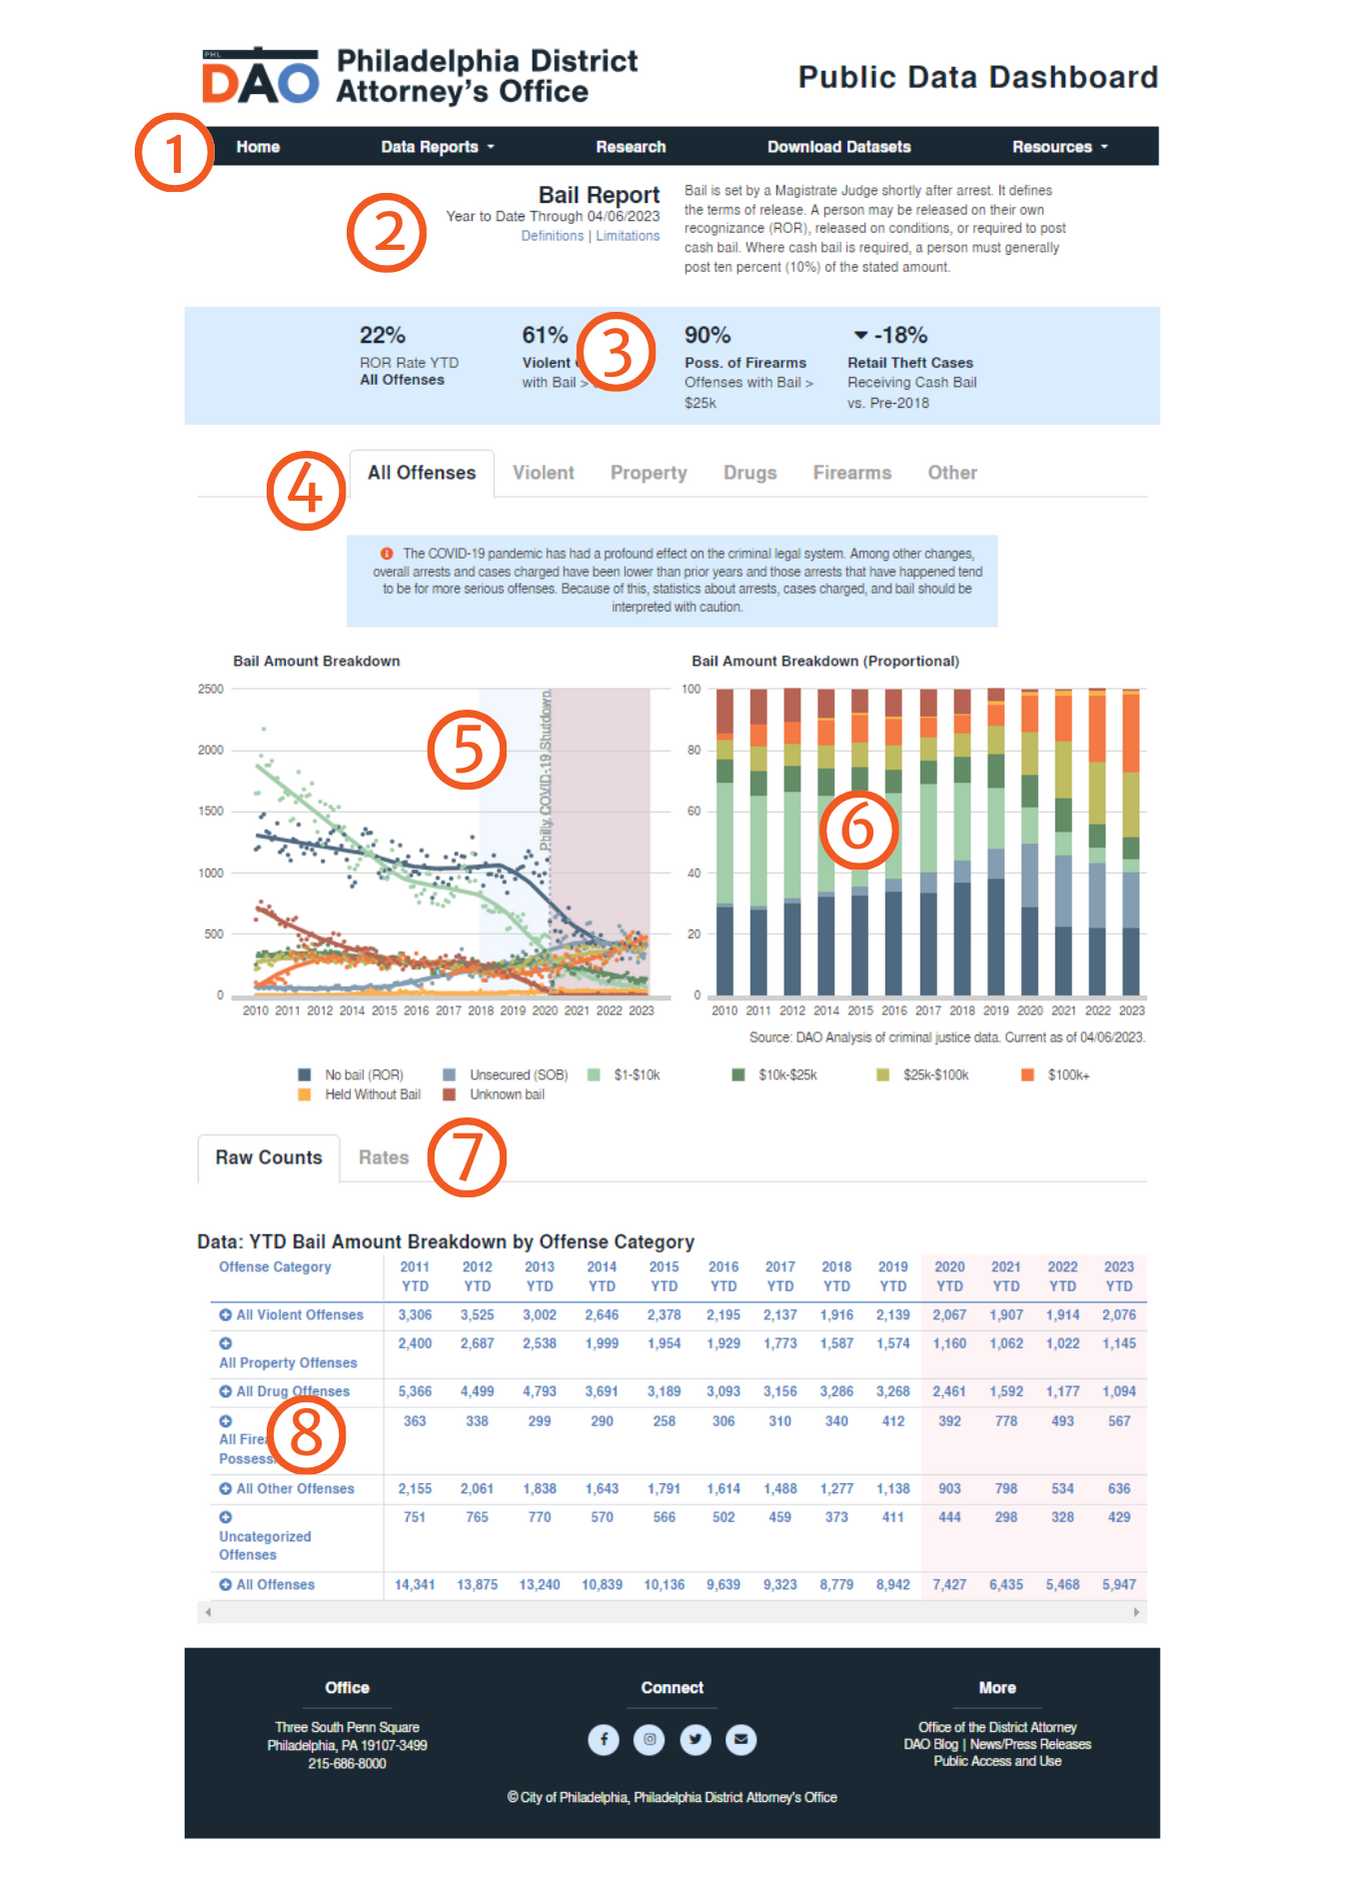
On each report page, you will find various data and metrics on the Criminal Justice System as well as graphs and maps showing the trends and geographic distribution of that data.
Components
-
Menu Bar
Allows for navigation between individual reports and pages of the dashboard. -
Report Title
The Report Title includes the name of the report, the date of the most recent update, and a brief description of the contents of the report. -
Key Metrics
Summary data points related to the report that the District Attorney’s Office is particularly interested in highlighting. -
Offense Type Tabs
Each report is broken down by the most serious offense in any given incident or case: all offenses, violent offenses, property offenses, and drug offenses. By clicking on a tab, the report below only shows data for the chosen offense category. For example, All Offenses shows data for all offenses, while “Drug Offenses” only shows data for drug offenses, broken down into different sub-categories like possession and sales. -
Chart 1: Trend over Time
An interactive chart showing the data in the report over time. The points represent actual quarterly or monthly data, the line is a trend line (using loess regression for the math nerds our there). Seeing data over time allows us to understand how changes in Philadelphia and policies throughout the criminal justice system affects the data we’re tracking. Mouse over the points in the chart to see monthly totals. -
Chart 2: Map or Proportional Bar
Depending on the report, the second chart is either a map or a stacked bar chart. The map shows how the data in the report is spread geographically throughout the city (by policy district) and allows you to compare years to each other. Click the areas on the map to see yearly totals for each geography. The stacked bar chart shows how the data in reports with multiple data categories relate to each other proportionally (e.g. case outsomes and bail). For example, this allows you to compare the proportion of cases that were diverted each year rather than just see that the total number of diverted cases was up or down. This is important because the total may have gone up (or down) because there were more cases in the system overall, not because the DAO was diverting any more cases. Mouse over each portion of the bar to see the rate of each type. -
Counts and Rates Tabs
These tabs allow you to toggle the data tables betweenraw counts and proportions. These are only available in some of the reports. -
Data Table
The data tables show the Year-to-Date (YTD) totals for each data point in a report. For each police category of offense, we’ve provided YTD totals for the years 2014 through present. We have provided the Year-to-Year change between this year and the previous year (YTD), the average of 2014-2017, the average of 2018-present, and a percentage change between the averages of 2014-2017 and 2018-present. In several reports, such as bail and case outcomes, we also provide proportaional information, showing what percentage of all data categories a single category represents.
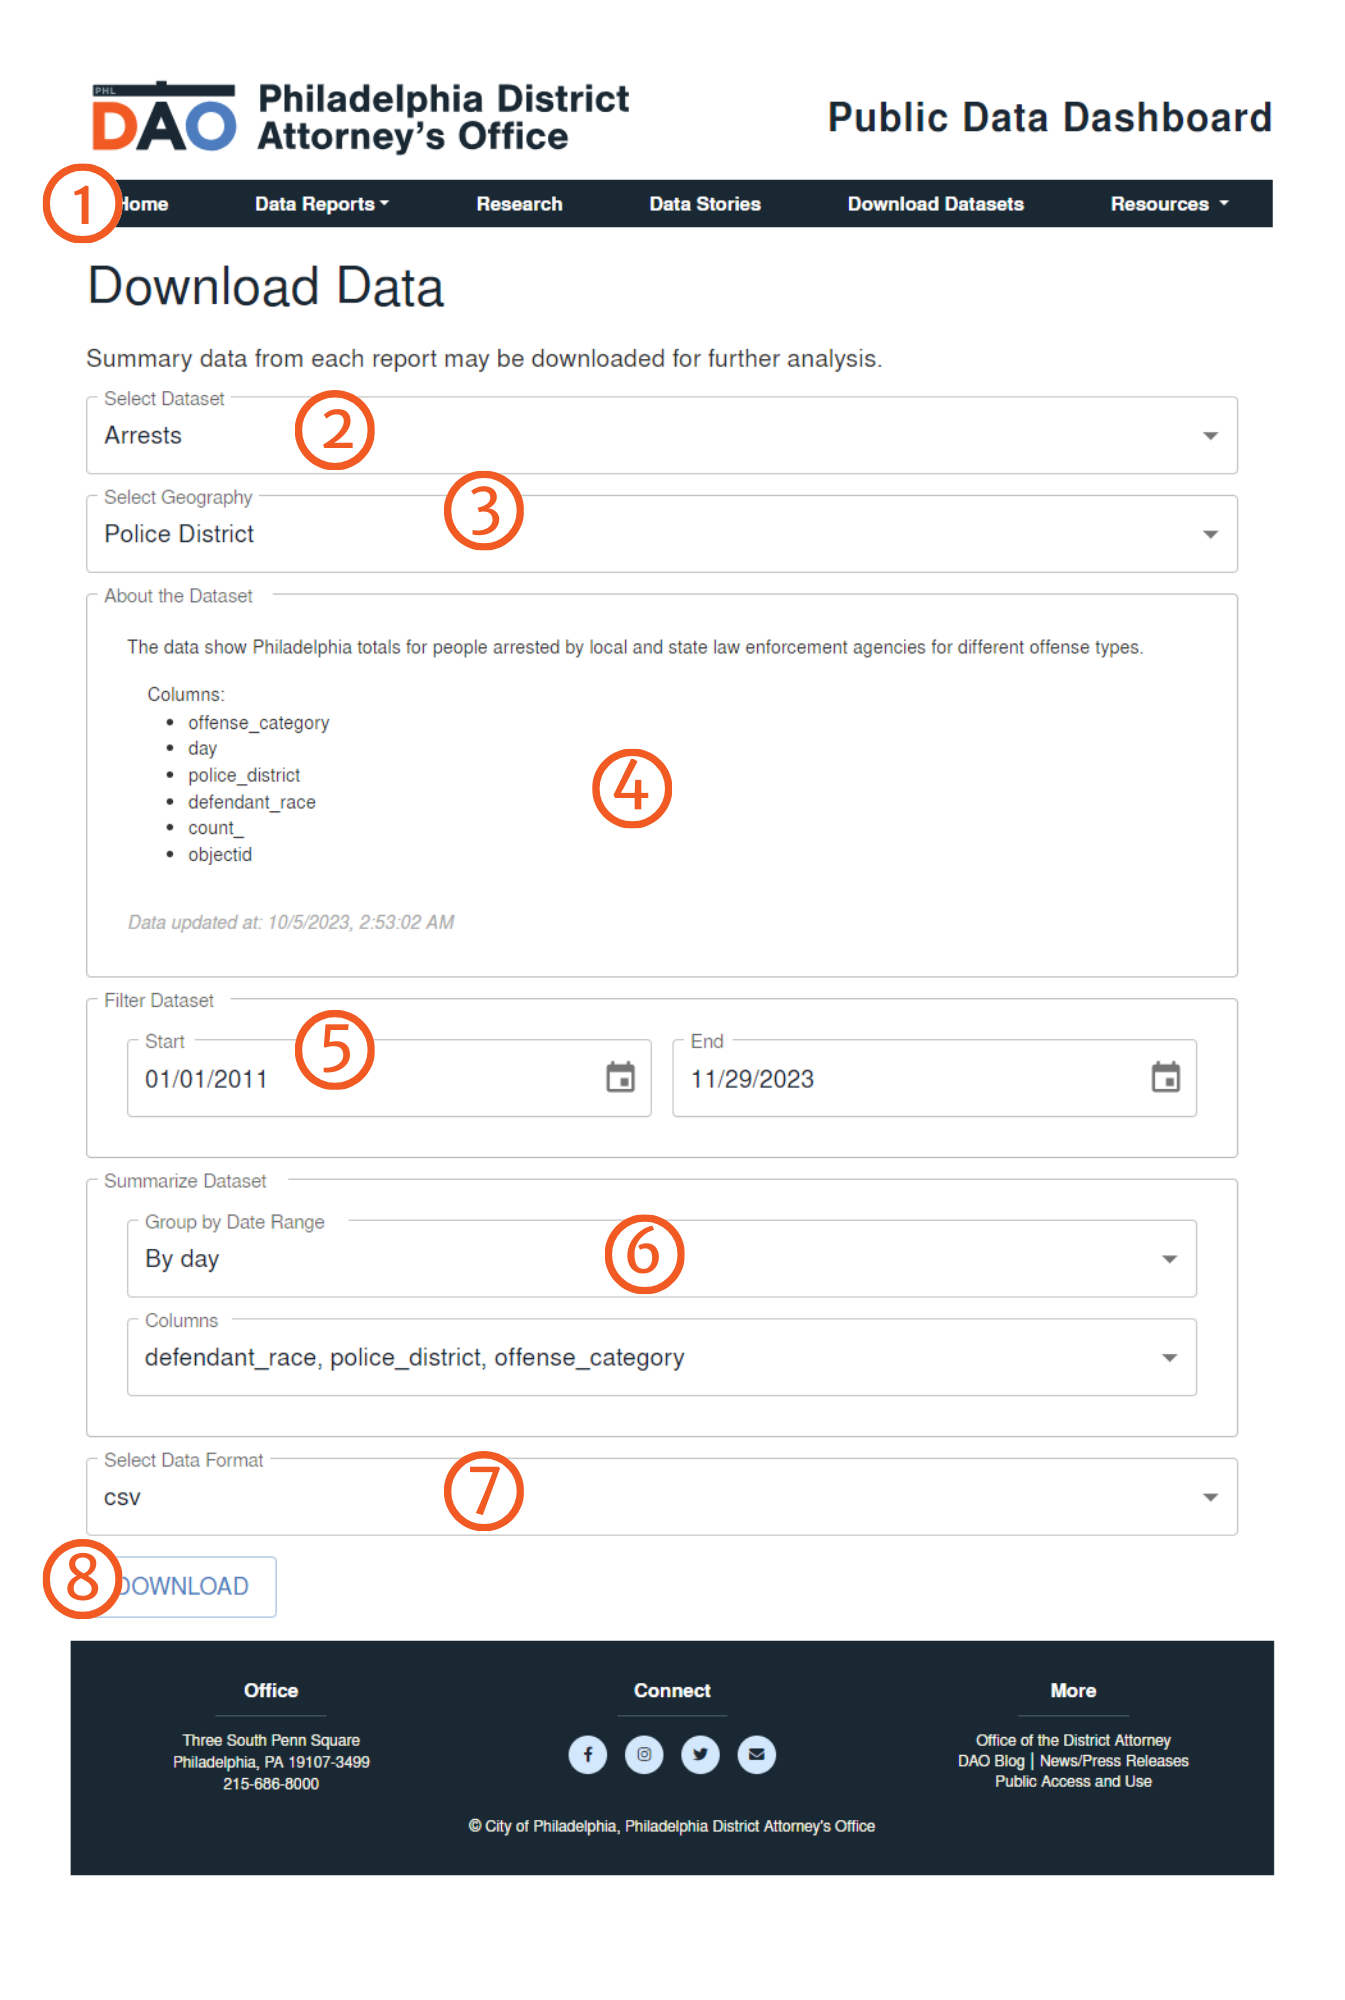
The dashboard reports show Year-To-Date numbers, but we understand that this isn’t enough to fully understand the criminal legal system. To that end, we are making downloadable data available down to a daily resolution level. Data is available by several different geographies: the whole city, police district, US Census Tract, and by zip code (technically ZCTA).
Components
-
Menu Bar
Allows for navigation between individual reports and pages of the dashboard. -
Select Dataset
Dropdown menu allows selection of any of the datasets produced by the DAO. Crime incidents data is available from the Philadelphia Police Department. -
Select Geography
Dropdown menu allows user to select geographical unit of focus. Each dataset is available by a few geographies: citywide, police districts, ZIP Codes (ZCTA), and census tracts. Most are provided as daily totals, though due to file size limitations we’ve restricted Census tracts to weekly totals. -
About the Dataset
Based on the dropdown selections above, this section contains a list of the variable columns within the data set, and a timestamp of when the selected data was last updated. -
Filter Dataset
This section allows the user to filter data by time period using a start and end date. The default start date represents the earliest available data, while the default end date represents today’s date. -
Summarize Dataset
This section allows a user to summarize numbers in the aggregate. The contains two drop down menus that allow user to 1) group by date range (year, year and month, day, etc) and 2) choose the selection of included columns. For example, if you wanted case outcomes numbers by police district, but only by offense and disposition type, you would de-select all columns except for “police_district”, “offense_type” and “disposition_type.” -
Select Data Format
Dropdown menu allows user to select the file type for the dataset. The available formats are csv and json. -
Download
This button initiates the file download of customized data based on the above settings. These files can be very large so please be patient.
The City of Philadelphia reserves all rights in the City’s databases and any data contained therein, and the end user’s use of the data does not constitute a transfer of, nor does the end user receive, any title or interest in the database or any other City data. The City of Philadelphia makes no representation about the accuracy of any specific information in this data and is provided “as is” and without Warranty of any kind. The user of this data will assume complete responsibility for any and all occurrences resulting from its use or display and will hold the City of Philadelphia harmless from any and all claims, demands, liabilities, obligations, damages, suits, judgments or settlements, including reasonable costs and attorneys’ fees, that arise from use of this data.